
Have you ever developed a React application that was blisteringly pretty to look at but insanely slow to work on? Or do you have any experience with working on an application to clean its code, and still don’t see any measurable performance improvement? This is where React Profiler comes in!
It is a powerful tool that helps developers track performance issues in the React application and allows them to optimize speed and performance.
Moreover, this article will reveal the working methodology of React Profiler, its usage, features, and setup method. Further, it will also enlighten you on how developers can utilize it to make their applications run faster.
A thing that needs to be mentioned is that you are expected to get the best outcomes by implementing React Profiler when you hire React developers with proven experience in the said field.
Profiling – A Basic Understanding
Before we dive into the React Profiler, you should have a basic understanding of what profiling is and its role in development.
Profiling is a technique or process of analyzing the runtime behavior of a program to identify or detect performance issues in the applications and determine the areas that need to be optimized. In simple terms, it involves the process of analyzing how much time and resources are being used by different parts of the code during runtime.
What Profiling Does:
- It measures the performance
- Identifies the bottlenecks in the code
- Understanding the part of the code that needs to be optimized
Significance of Profiling
- Profiling enhances the performance of the application and enables the program to run faster and more efficiently.
- It optimizes the resources such as CPU, memory, and I/O, which leads to reduced costs and improved scalability.
- Promotes better decision-making.
React Profiler – What is it?
The React Profiler is a performance monitoring tool in the React Developer Tools extension. With this tool, developers can record, visualize, and analyze React component rendering behavior.
Moreover, it supports class and functional components.
React Profiler helps you identify areas that might require optimization by recording the rendering timing of each component when you analyze a React application.
Importance of React Performance Optimization
The React performance is overly dependent on the structure and rendering of the components. Poor React app performance can result in:
- Slow user interface and bad user experience
- Reduced SERP rankings and longer load times
- Excessive usage of CPU and memory
- Reduced conversion rates and user retention
These bad outcomes will eventually lead to business failure. Competitive industries such as e-commerce, finance, and SaaS platforms can’t endure even minor delays and slow speeds, which affect customer satisfaction and business success.
Do you know?
React is the 2nd most popular web development framework technology with over 39% of users around the globe. Furthermore, there are over 2 billion websites on the internet. Of these websites, around 1.3 billion use React for designing user interfaces.
Features of React Profiler
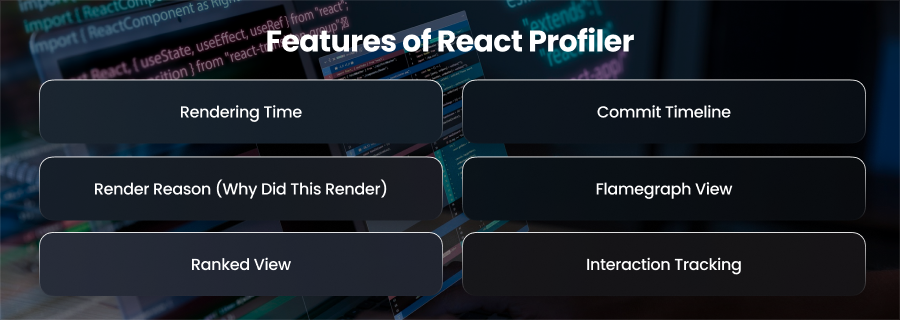
Rendering Time
Firstly, the React profiler displays the precise rendering time of each component, assisting you in identifying areas of your application that cause lag when updates are being made.
Commit Timeline
A visual timeline of render cycles helps you monitor performance trends over time by showing you when and how often components are rendered.
Render Reason (Why Did This Render)
It identifies superfluous or unexpected updates by indicating what caused a render, such as modifications to the props, state, or context.
Flamegraph View
React Profiler displays the component tree as a heat map, with slower renders shown by longer bars. It assists you in locating costly or complex nested renderings.
Ranked View
This feature makes it simple to identify the parts of your program that require the most performance by listing them in descending order of render time.
Interaction Tracking
It associates the component updates with certain user interactions, such as clicks. This allows you to track how and where user actions affect render behavior.
How Does the Profiler Work?
There are two main props in the Profiler component:
- id: It is the string identifier for the Profiler component. This helps in segregating multiple profilers in the application.
- onRender: It is a callback function that is called every time a component is wrapped by the Profiler re-renders. Moreover, this function receives several parameters, including the render’s id, phase, and actual duration.
How to Set Up the React Profiler
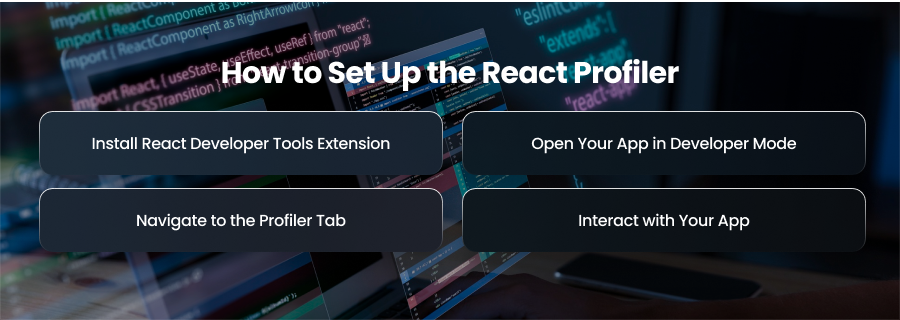
To start working with React Profiler, follow these steps:
Install React Developer Tools Extension
Firstly, you need to install the React Developer Tools extension, which is available for Chrome and Firefox. After installing, you will get to see two new tabs, i.e., Components and Profiler.
Open Your App in Developer Mode
Secondly, ensure to run your application in development mode. The Profiler doesn’t work in production mode by default.
Navigate to the Profiler Tab
Now, you need to find the Profiler tab in the DevTools. Click the “Profiler” tab and then click on “Record” to start component renders.
Interact with Your App
Lastly, perform actions like clicking buttons, navigating pages, or typing in forms. Later, stop recording to see the results.
React Profiler Metrics
The React Profiler presents the render data in two main views:
- Flamegraph View
- Ranked View
Flamegraph View
The flamegraph or flame chart view illustrates the condition of the React application during a specific commit. The bars in the charts represent the React components. Each component is represented by a bar, and the bar’s size and colors indicate the duration of the component and its nested elements.
Moreover, the width of the bar tells about the time spent during the component’s last rendering. Whereas the color indicates the time spent in the current commit.
Elements of the Flamegraph
- Bars: Represents a component in your React application.
- Width of Bars: The width of the bar in the flamegraph represents the amount of time a component took to render.
- Colors: The varying colors help identify different components.
- Hierarchy: The flamegraph displays the component hierarchy, showing which components are children of others.
Ranked Chart
The ranked chart or ranked view’s job is to represent a single commit. Each bar in the ranked chart represents a React component. The chart is ordered in descending order to keep the components on top that took the longest to render.
How React Profiler Plays Its Part in React Development
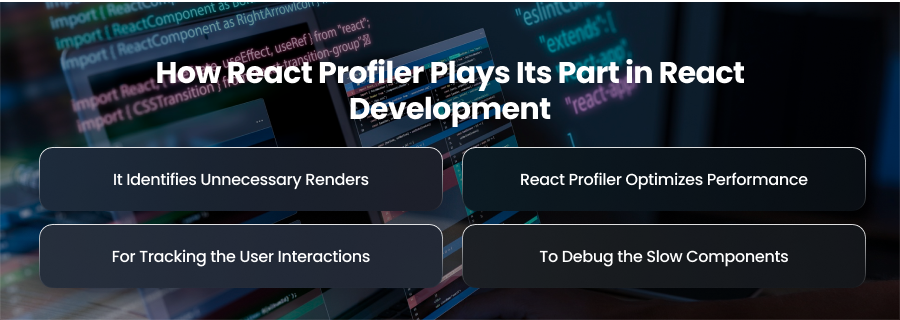
Now, let’s understand the role of React Profiler in modern-day React development.
It Identifies Unnecessary Renders
In React development, the significant role that React Profiler plays is identifying or detecting the components that re-render without any actual change in the props or state.
For example, a child component continuously re-renders despite no change in props. In this instance, you can use React.memo to avoid re-render.
React Profiler Optimizes Performance
React Profiler is used to:
- Apply memoization, such as React.memo, useMemo, and useCallback
- For splitting the components
- Implementing lazy loading on heavy parts of the UI
For Tracking the User Interactions
With React Profiler, one can trace which component is updating results from a specific interaction. An interaction can be clicking a button, typing an input, etc.
To Debug the Slow Components
Lastly, if your app’s behavior is sluggish, React Profiler can help. It will assist in finding the component that is causing the slowdown.
Tips to Optimize Performance using React Profiler

Let’s find out the best tips to get the best performance out of React applications.
Memoization with React.memo()
Implement memoization techniques using React.memo(). It will prevent re-renders of functional components if props haven’t changed.
Use useMemo() for Expensive Calculations
During React development, there come expensive calculations that need you to play smartly. In such situations where cache values are computationally heavy, such as filtered arrays or calculation results, it is better to use useMemo().
Use useCallback() for Stable Function References
You can use useCallback() because it ensures that the function doesn’t change on every render. Moreover, it prevents the child components from re-rendering.
Implement Code Splitting and Lazy Loading
Code splitting and lazy loading are evergreen techniques that help resolve many performance issues in your React applications. Implementing strategically can hugely improve the performance of the application. For this, you need to split your bundle using React.lazy() and Suspense to load components only when needed.
Avoid Inline Functions and Objects
You need to avoid inline functions and objects in JSX. Because the inline functions or object literals in JSX create new references on each render.
Tools to Use With React Profiler
There’s no doubt about the abilities of React Profiler. However, it is even better if combined with the given tools:
- Lighthouse: It is an audit tool used to check performance and accessibility thus it is a perfect tool when it comes to production insight.
- Web Vitals: It takes into account such fundamental measurements as LCP, FID, and CLS.
- Why Did You Render: It is only a development tool. It is there to record superfluous renders in the console.
- Chrome Performance Tab: Incorporation of Chrome Performance Tab will allow developers to examine low-level events and how the browser is working and rendering.
- Webpack Bundle Analyzer: Having Webpack Bundle Analyzer, you find it easier to visualize the size of your app bundles. This assists in the correct split decisions of the code.
Final Words
You must have realized that React Profiler is a crucial tool that every React developer needs to know how to use. It is essential for improving React apps’ performance. Additionally, it identifies the factors behind the lag in your application.
Therefore, profiling approaches assist you in creating responsive, seamless user experiences, regardless of the complexity of the dashboard or the application.
So, next time you feel your app is slowing down, bring React Profiler in place.