While debugging can be time-consuming and laborious, it is an essential stage in software development, particularly for complicated React applications. Sometimes it can feel like you are Hercules fighting the multi-headed Hydra of bugs and issues.

Determining the root of problems may be challenging since React developers primarily rely on component-based design, state management, and asynchronous processes.
So if you are a developer looking for debugging solutions or a company that is about to React developers and wants to learn about their debugging process, this blog will show you how to debug React.
What Are The Basics of React Debugging?
Before diving into techniques, it’s important to understand common sources of bugs in React apps. Many issues stem from a mismanaged state, incorrect data flow between components, or challenges with asynchronous functions and API calls. Knowing the potential root of an issue can save you time when debugging, as you can focus your efforts on the most likely areas. Early debugging of apps can help in optimizing React-built web apps and ensure smooth performance.
In React, most problems fall into one of these areas:
- Components: Errors in component logic, rendering issues, or lifecycle problems.
- Data Flow: Prop drilling, unexpected data types, or state mismanagement.
- Asynchronous Operations: API calls, promises, and state updates that don’t sync correctly.
With these general problem areas in mind, let’s explore specific techniques and tools to tackle them effectively.
The Best React Debugging Tools
- Chrome Dev Tools
Chrome DevTools offers a comprehensive environment for examining and improving online apps, not just a debugging tool. Here’s how it aids in React debugging:
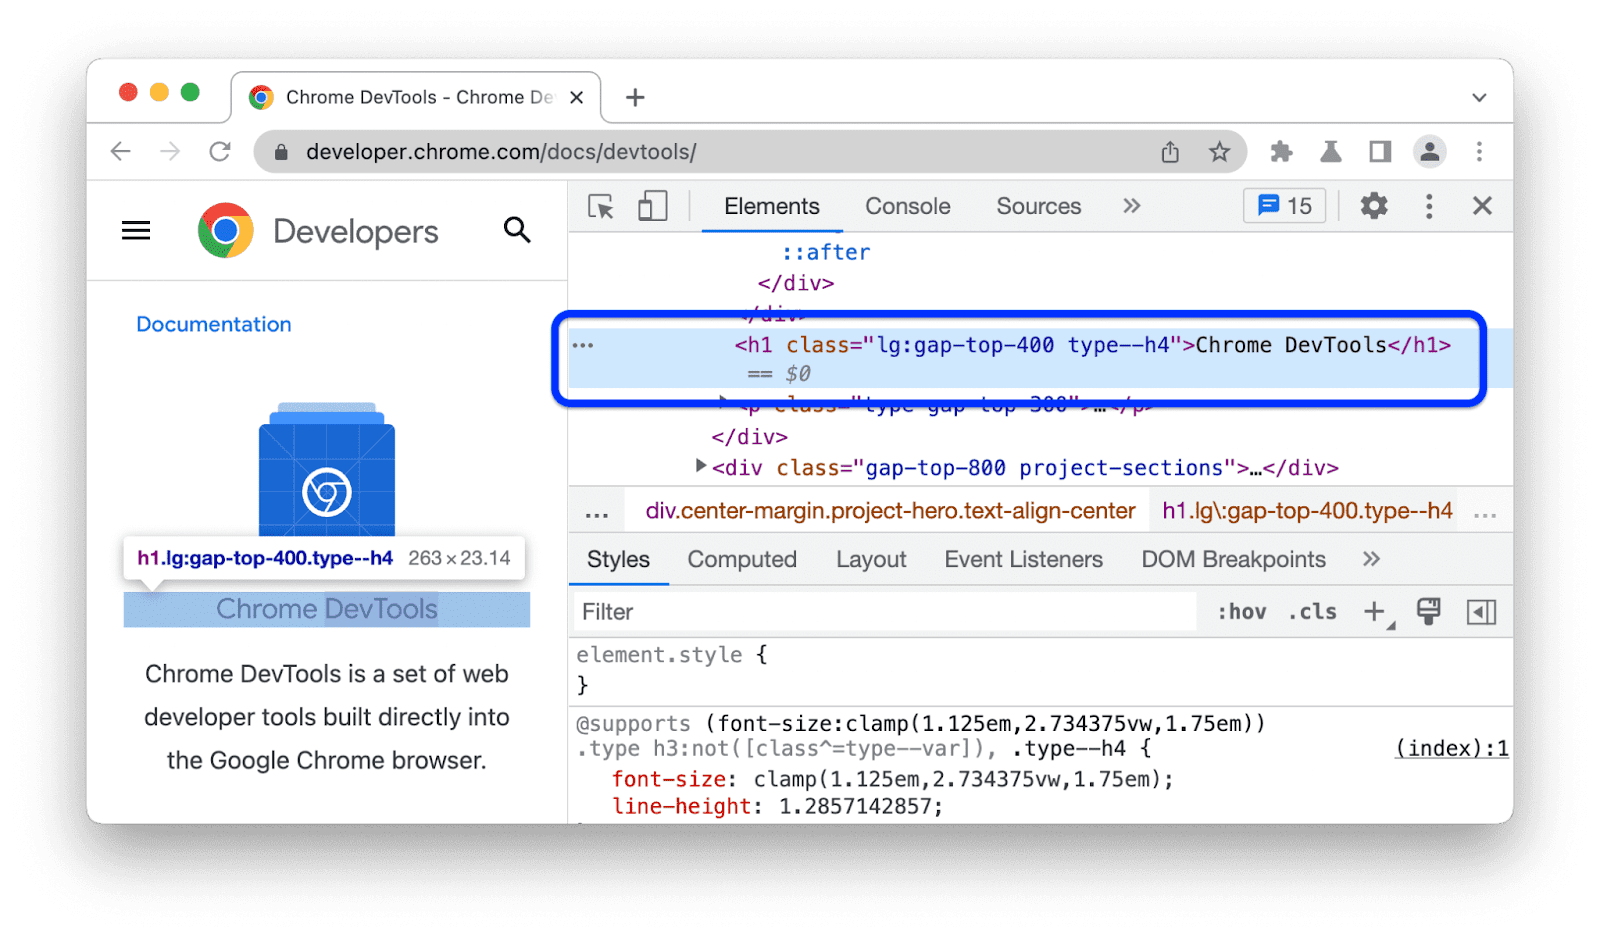
Elements Panel
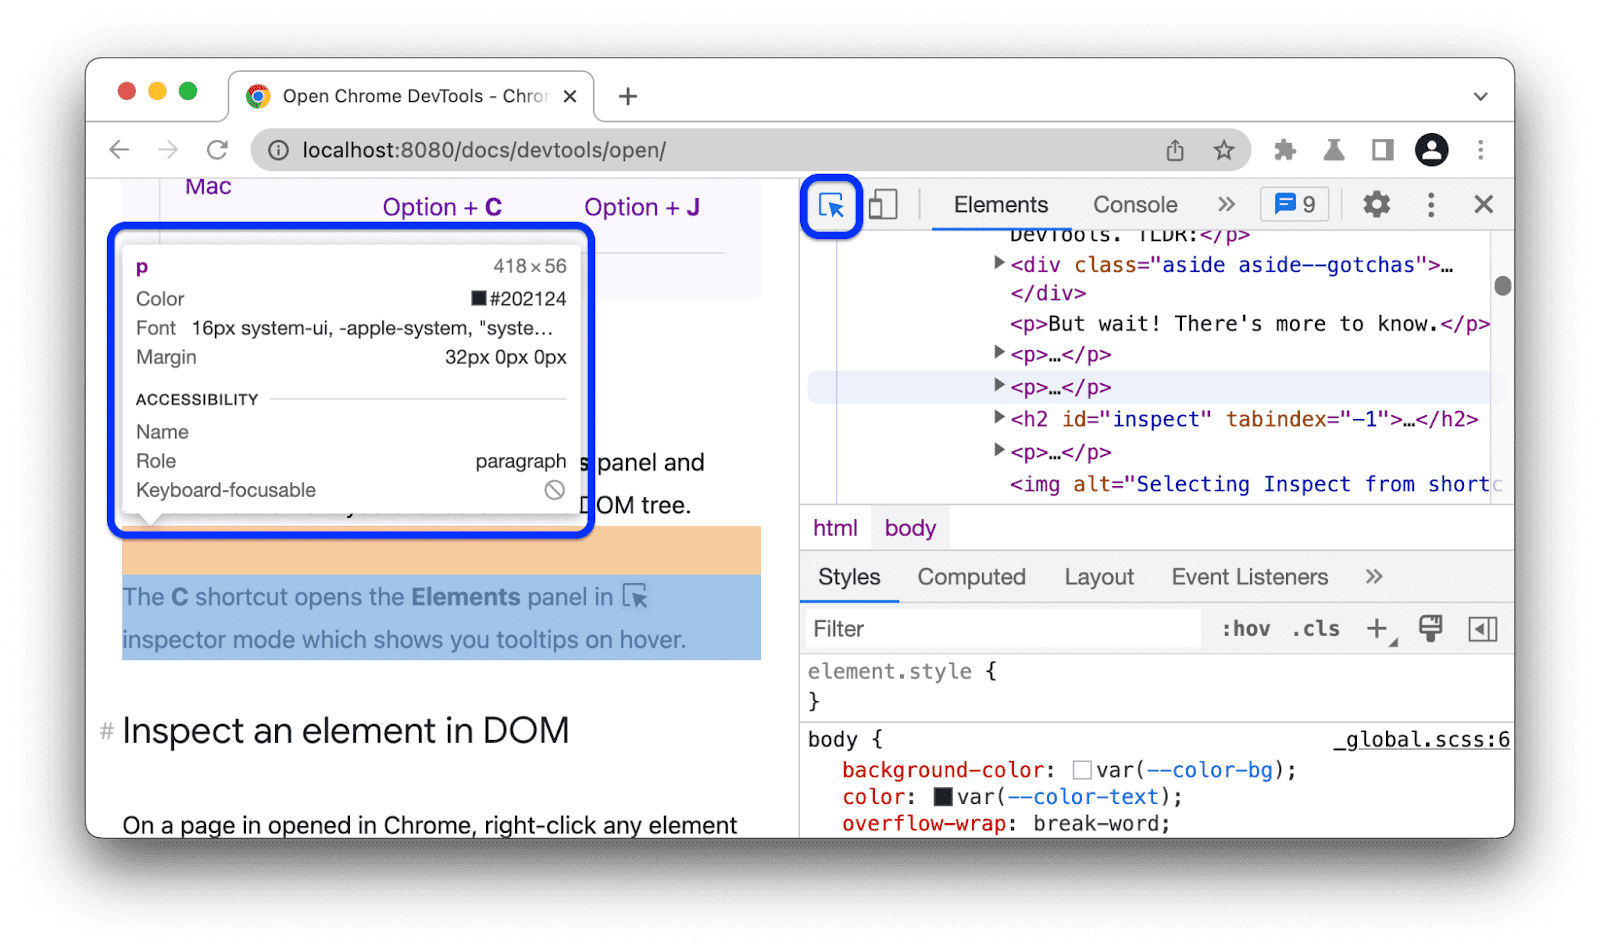
You can inspect and modify the HTML and CSS of elements in real-time, helping you see exactly how a component’s styling changes affect its layout. This is particularly helpful in React, where component styles can sometimes be tricky to debug due to CSS-in-JS libraries or conditional styling.
Console
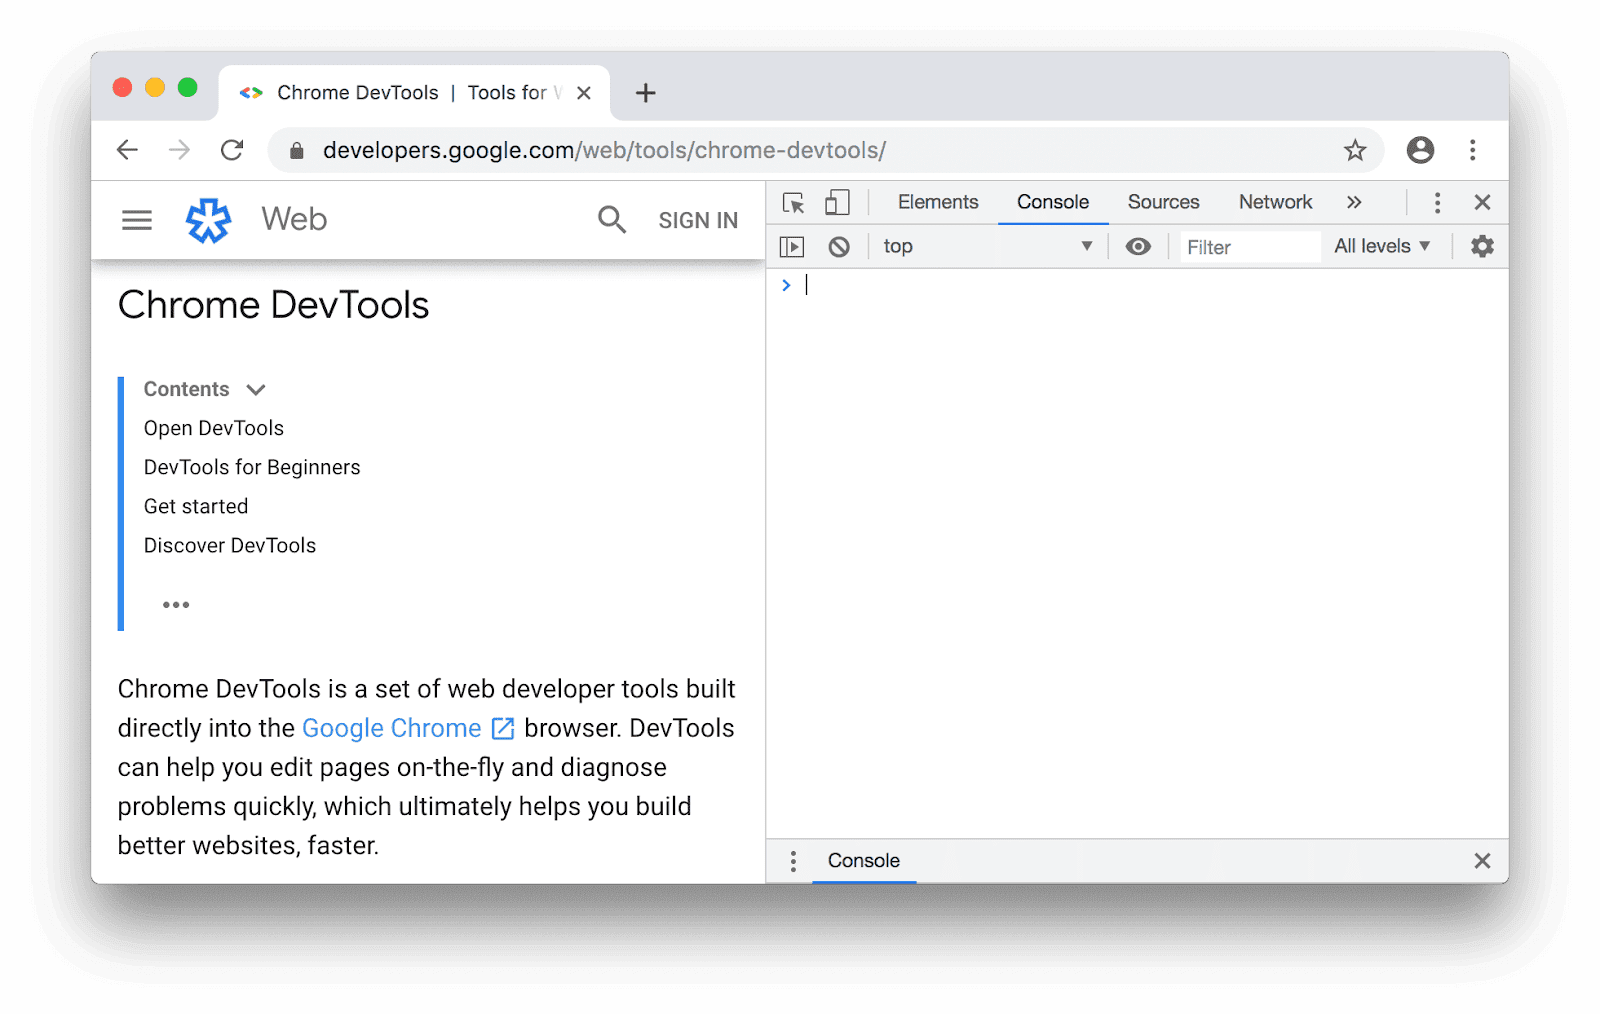
The Console tab provides real-time feedback and insights, allowing you to log values of variables, inspect props and state, and monitor error messages. This is invaluable for React debugging, where you might need to track the flow of props down the component tree.
Sources Panel
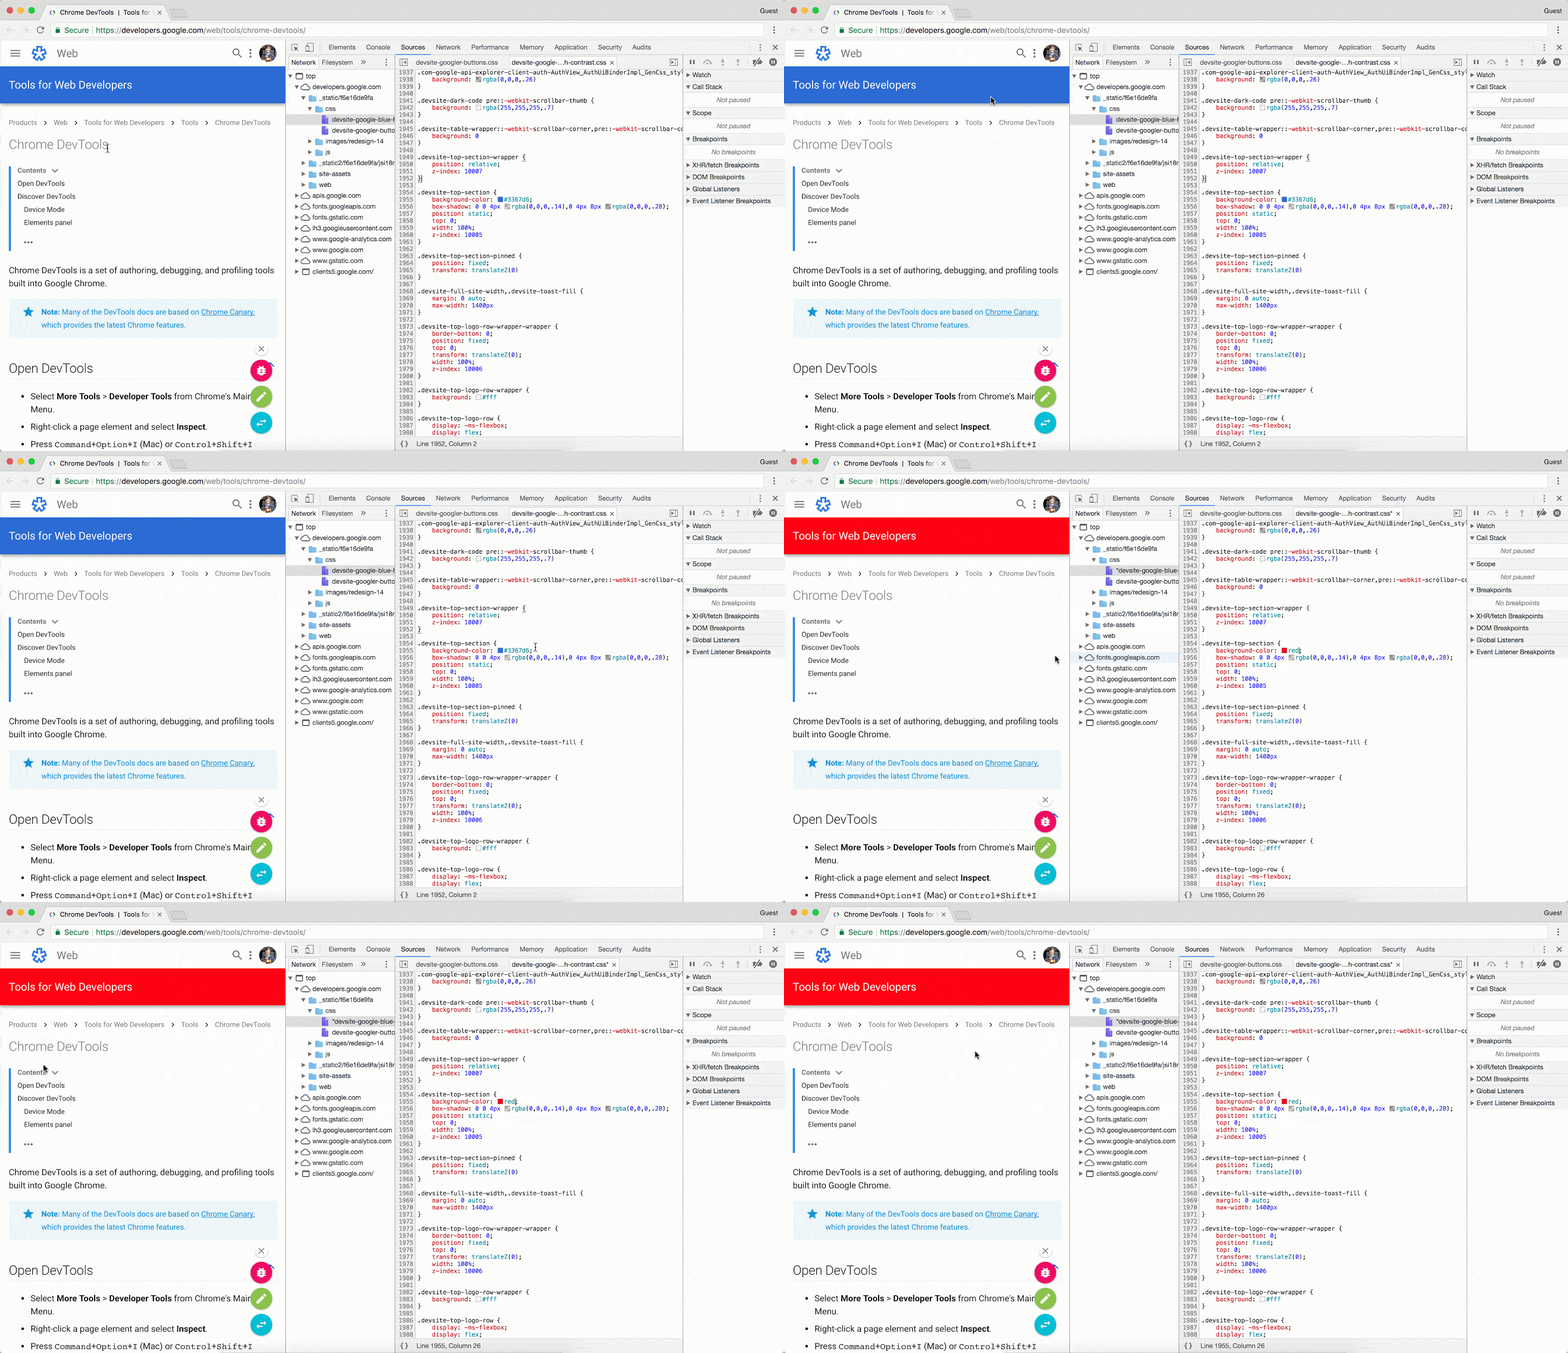
You may walk through your code and create breakpoints in this area, which makes it simpler to examine variable values at each stage and comprehend how data moves through your application. You may add conditional breakpoints, establish breakpoints on certain lines or functions, and utilize Watch Expressions to track changes in the values of variables.
Performance Panel
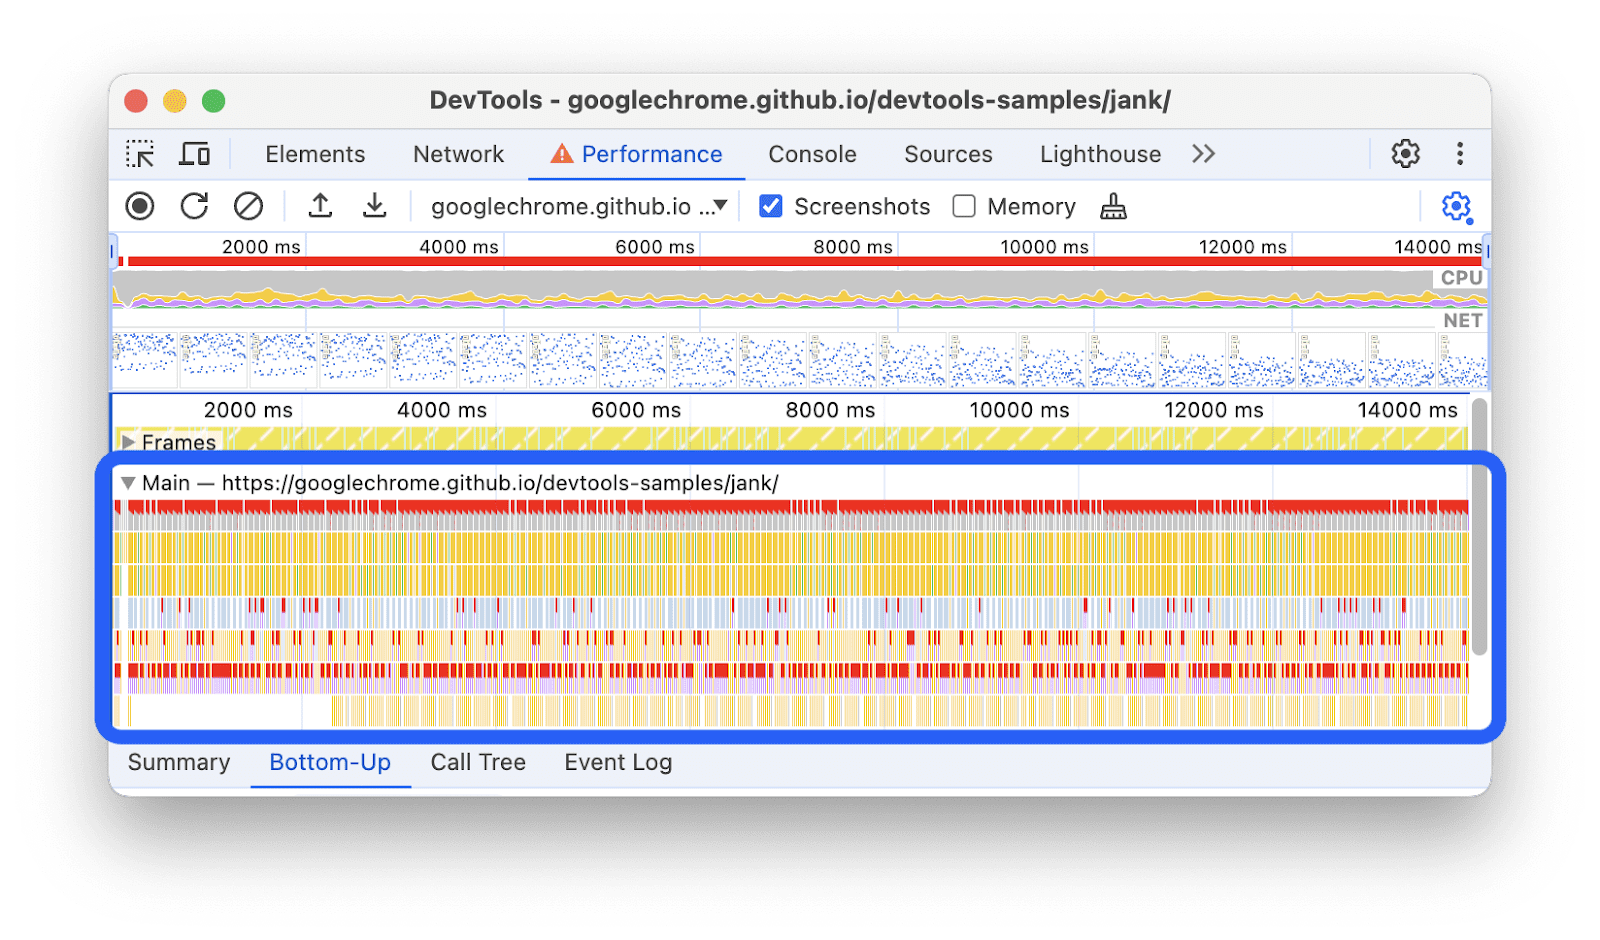
For React developers aiming to optimize their applications, the Performance panel is essential. It lets you record your application’s runtime, showing detailed frame-by-frame views of where bottlenecks or performance issues might lie. You can use this data to optimize React component render times or to spot re-renders caused by inefficient code or state management.
Network Panel
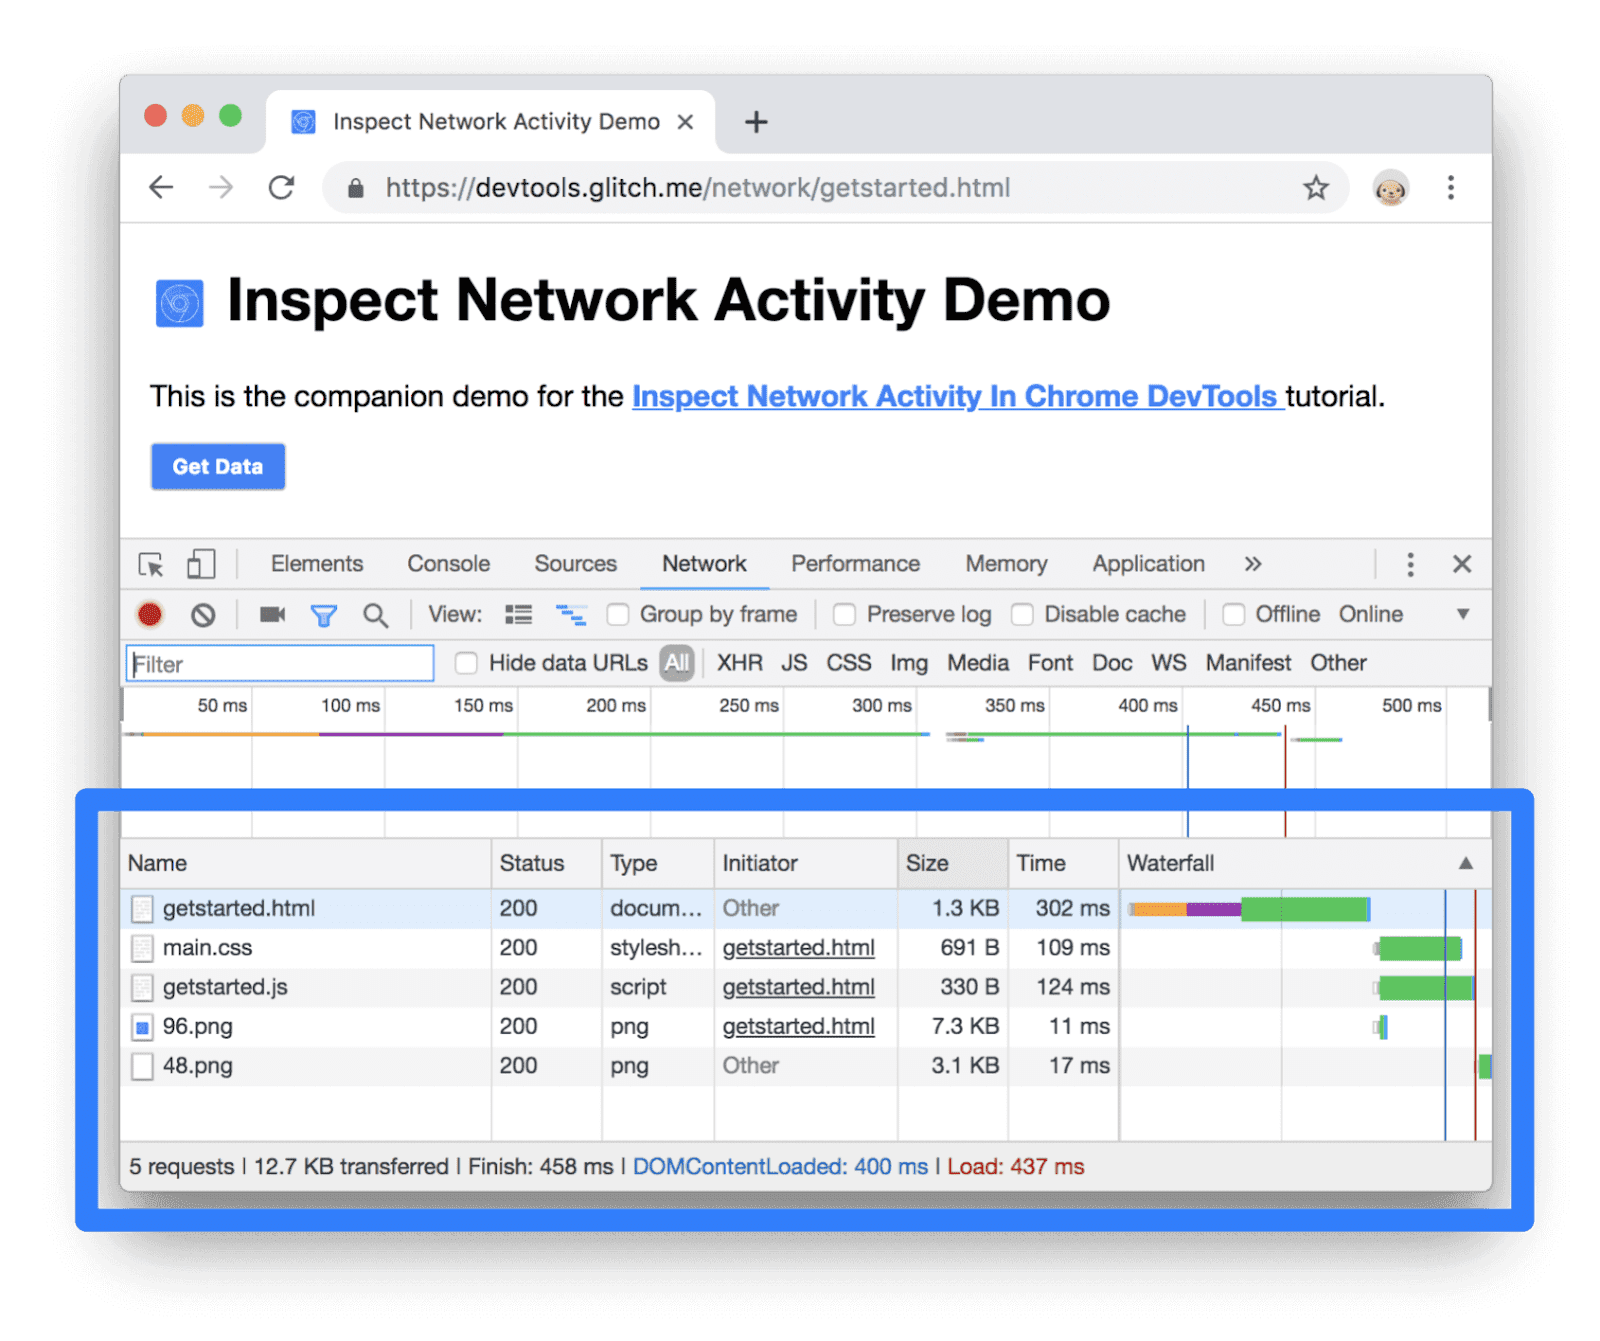
In a React app, especially one that interacts heavily with APIs, understanding network requests is critical. The Network panel allows you to inspect API requests, understand the response times, and analyze how these requests affect your component rendering.
- React Developer Tools
Designed specifically for React, React Developer Tools (React DevTools) offers targeted insights into React-specific structures and data flows:
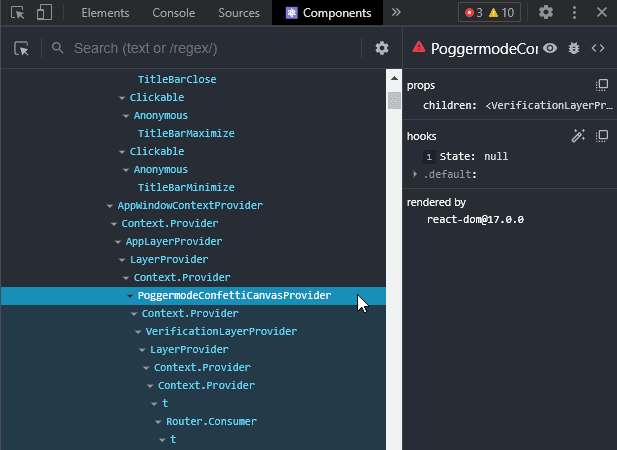
Component Tree
This displays your app’s component hierarchy, helping you visualize the relationships between components. By selecting any component, you can see its props and state, which is crucial for debugging issues in data flow or state management. If your component isn’t rendering as expected, the tree view can help you pinpoint whether it’s receiving the right data.
Hooks Inspection
For developers using React’s hooks API, React DevTools allows you to inspect and monitor the values of each hook. This is particularly useful for debugging useState and useEffect hooks, ensuring that their values change as expected throughout the component lifecycle.
Profiler
The Profiler tool helps analyze the rendering performance of each component. You can record and replay the component rendering process, checking how long each component takes to render and spotting areas where optimization is needed. This is ideal for reducing unnecessary renders in larger applications, where small performance improvements can significantly enhance user experience.
Context and State Debugging
For apps using React Context API for state management, React DevTools lets you see which components are consuming context values and whether they’re updating as expected. This can help avoid problems like excessive re-renders or stale data due to unoptimized context usage.
- Visual Studio Code JavaScript
VS Code’s built-in JavaScript Debugger enhances the debugging experience by allowing you to debug directly in your IDE, creating a streamlined workflow.
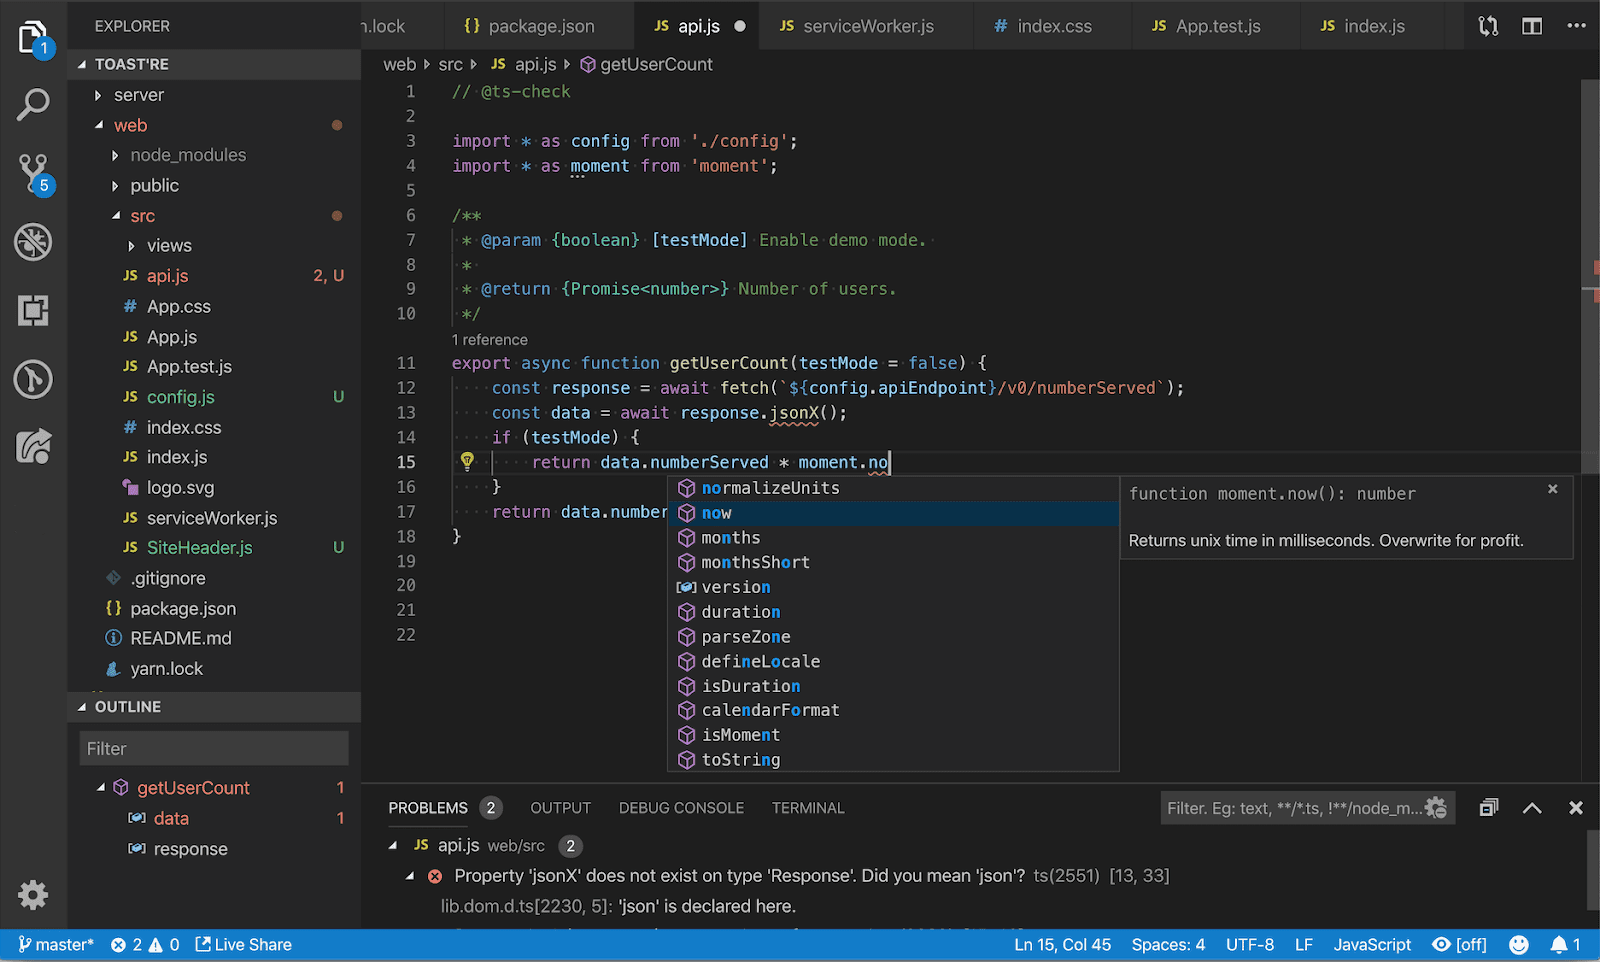
Breakpoints and Conditional Breakpoints
VS Code’s debugger supports standard breakpoints, allowing you to pause execution and inspect variables at specific points. Conditional breakpoints are particularly useful in complex React applications where you may want to halt execution only when certain criteria are met (e.g., when a variable reaches a specific value).
Watch Expressions
This feature lets you monitor specific expressions or variables and watch their values change as you step through the code. It’s especially useful in React apps, where props, state, or computed values might affect component rendering.
Debug Console
In the Debug Console, you can interact with your running code, test expressions, and evaluate functions on the fly. For instance, you can test changes to state or props without needing to restart the entire app, which saves time and allows you to experiment with solutions to bugs.
Integrated Extensions
VS Code offers a range of extensions that make debugging React even easier. For instance, you may integrate Visual Studio Code with Chrome DevTools using the Debugger for Chrome extension. This enables you to walk through code in the browser and create breakpoints in Visual Studio Code. Prettier and ESLint may also assist in identifying formatting and syntax mistakes, enabling you to maintain clean code that complies with React best practices.
Live Share
For remote debugging, VS Code’s Live Share feature allows you to collaborate with other developers in real time. This can be helpful for pair debugging complex issues or getting help from teammates on tricky React bugs.
- Raygun4JS and Raygun APM
Raygun’s suite is a powerful resource for tracking errors and monitoring performance in production, particularly in customer-facing React applications.
Real-Time Error Tracking
Raygun4JS can capture errors as they happen in production, providing detailed stack traces and context around each error. This helps React developers understand the root cause of issues without having to reproduce them locally. Error tracking also includes custom tags and grouping, so you can see whether a single issue is affecting many users or if there are multiple unique issues.
User Tracking
Raygun allows you to trace errors down to individual users, so you can see exactly which users are affected and understand the circumstances around each error. This can be especially useful in applications where different users have varied data or configurations, allowing you to fix bugs faster and improve user experience.
Performance Monitoring with Raygun APM
You may identify backend problems that might be affecting the React front-end by using Raygun’s APM (Application Performance Monitoring) function, which provides comprehensive insights into server performance. Because you can link frontend defects or performance problems to backend services, this is helpful for full-stack engineers or teams who work on both front-end and back-end code.
Custom Dashboards and Alerts
With Raygun’s configurable dashboards, you can keep an eye on particular data or get notifications when error or performance limits are surpassed. This facilitates proactive debugging, which allows for rapid response times by warning React developers of problems before users even mention them.
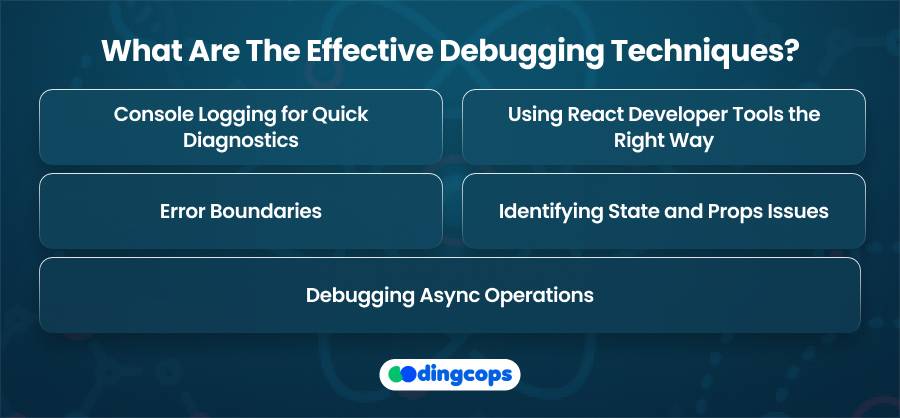
What Are The Effective Debugging Techniques?
1. Console Logging for Quick Diagnostics
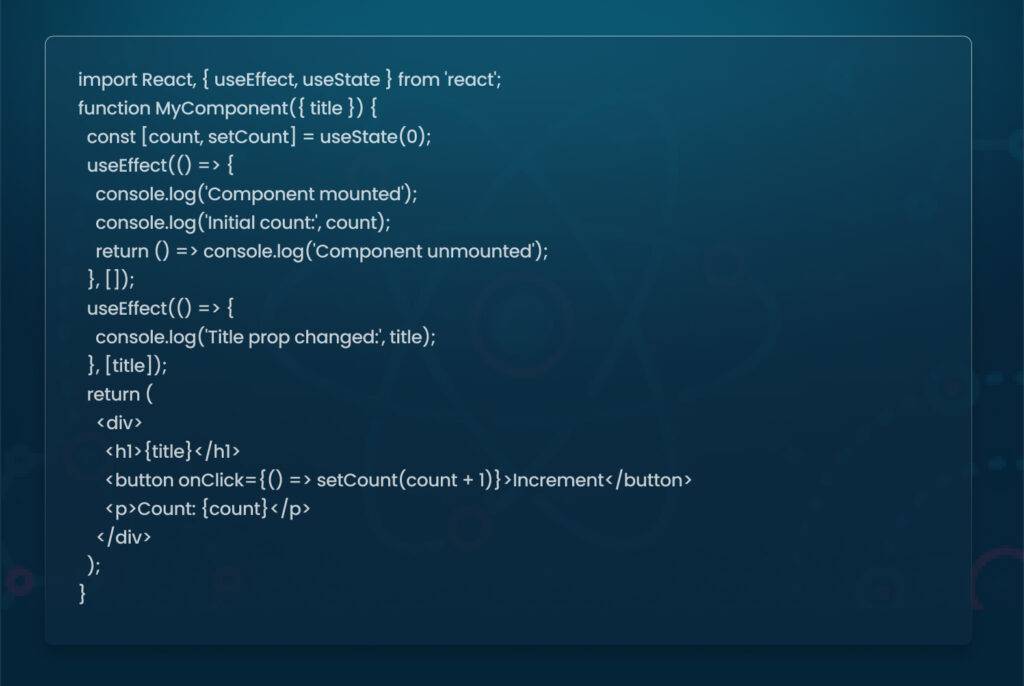
Console logging is a straightforward but highly effective method for quick diagnostics. Using console.log can provide immediate feedback on variable values, function execution, or error messages. This method is particularly useful when you want to see how data is flowing through components or where a specific function might be causing unexpected behavior.
For more readable logging, you can use various console commands that allow you to log arrays, objects, warnings, and errors in more structured or prominent ways. While console logs shouldn’t be your only debugging tool, they are often the fastest way to isolate an issue.
Here’s an example of console logging:
2. Using React Developer Tools the Right Way
React Developer Tools let you examine components, props, and state in real-time. This is especially useful for identifying prop or state mismatches that may cause rendering issues.
With React Developer Tools, you can inspect and edit props and state directly, making it easier to test different scenarios and troubleshoot unexpected behavior. You can also use the component hierarchy to trace where a bug might originate. The Profiler tab is particularly useful for spotting performance issues, as it shows how components are rendered and re-rendered over time.
3. Error Boundaries
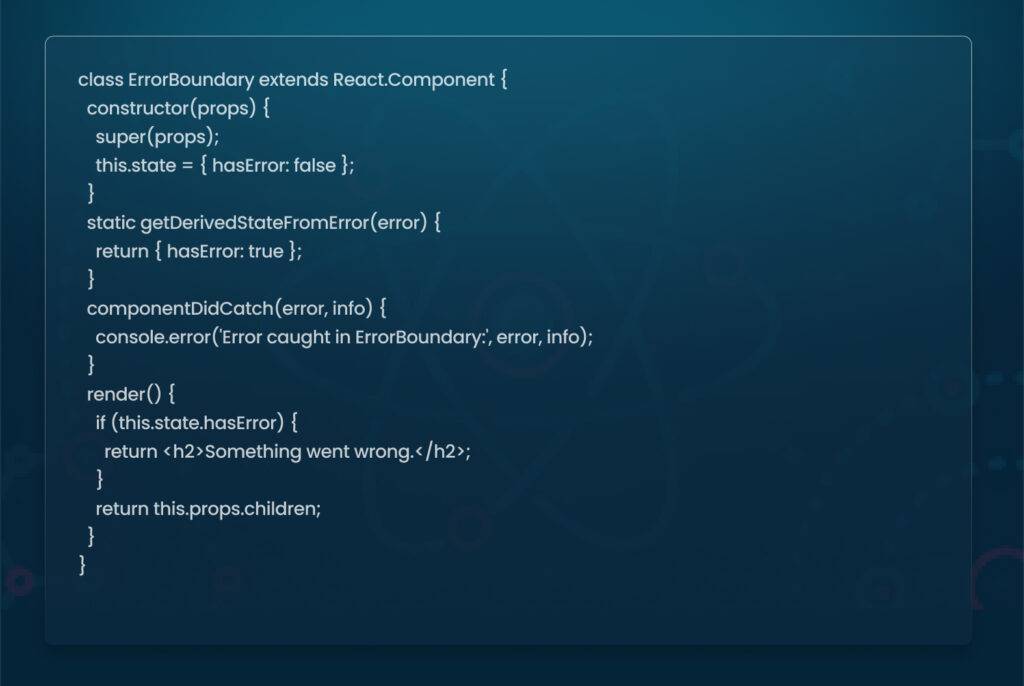
React Error Boundaries allow you to catch JavaScript errors within component trees and display fallback UI. They are essential for recording runtime faults and can assist in identifying the exact location of issues without causing the application to crash. You may improve error management and offer clear notifications when anything goes wrong by enclosing important components of your application in Error Boundaries.
Here’s an example of implementing error boundaries in React:
4. Identifying State and Props Issues
State and props are the backbone of React apps, but they can also be a source of confusion. Common issues include unnecessary re-renders due to incorrect state updates and prop drilling issues when passing data down multiple levels. You can track state changes and identify the cause of odd behavior with tools like Redux DevTools and React DevTools. For instance, setting breakpoints in useEffect and recording state changes are two ways to diagnose state issues.
5. Debugging Async Operations
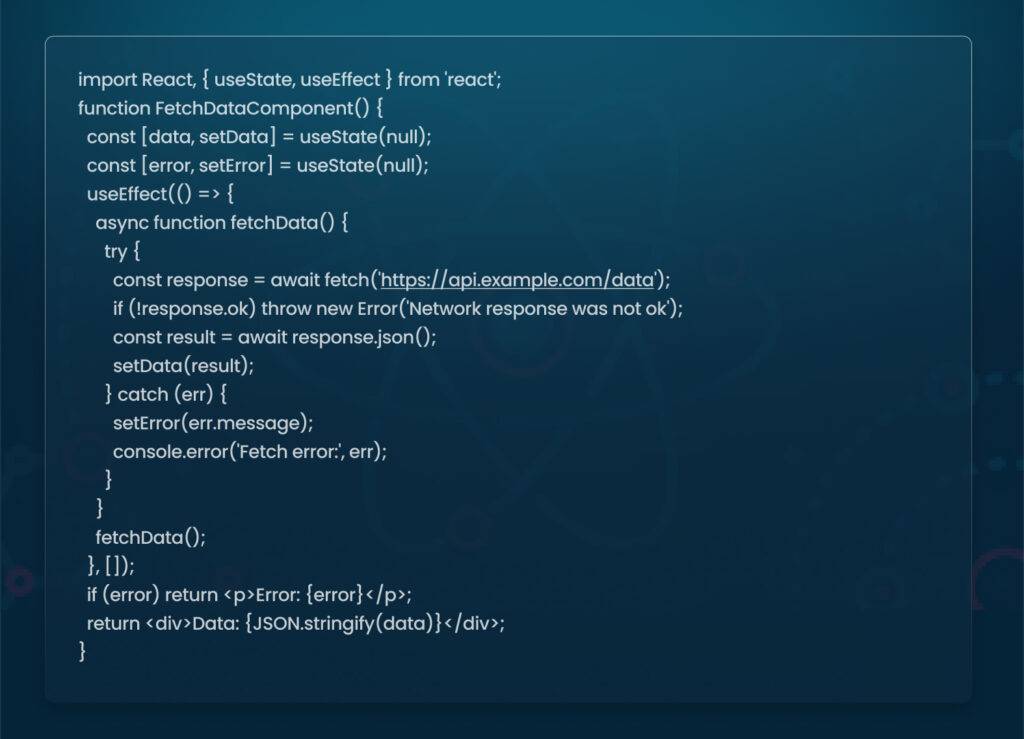
Asynchronous functions and API calls are another frequent source of bugs in React. Debugging them requires monitoring how state changes in response to data fetches or async actions. You can troubleshoot async issues by checking the status and responses of API calls in the Network tab of the DevTools and implementing appropriate error handling within your async functions.
Here’s an example of adding error handling in async functions:
Advanced Debugging Techniques
After mastering the fundamentals, you may attempt these sophisticated methods for a more thorough debugging experience.

1. Breakpoints and Source Maps
You may interrupt code execution and check the current state of variables at particular lines of code by using breakpoints. Because source maps let you look at the original code instead of the minified version, they facilitate debugging in production settings. Breakpoints are extremely important for testing conditional logic, examining the value of variables at a specific line of code, and validating how values change using functions.
2. Using a Code Linter (ESLint) for Preventive Debugging
Linters like ESLint help identify potential issues before they become runtime errors. ESLint can be configured to follow React-specific best practices, catching issues like unused variables, improper imports, or missing dependencies. Linters enhance the readability and quality of code while averting typical mistakes before they arise. Here’s an example:
while averting typical mistakes before they arise. Here’s an example:
“extends”: [
“eslint:recommended”,
“plugin:react/recommended”
],
“rules”: {
“react/prop-types”: “off”,
“react/jsx-uses-react”: “off”,
“react/react-in-jsx-scope”: “off”
How to Test for Debugging?
You may write unit and integration tests with testing frameworks like Jest and React Testing Library, which can be quite helpful while troubleshooting. Bugs may be found early in the development process by writing tests for your components, particularly when you make modifications to existing code. Testing components for expected behavior can often reveal overlooked issues and prevent them from making it to production. Additionally, testing components using unit and integration tests may help find issues early in the development process and guarantee that web programs stay responsive.
import { render, screen, fireEvent } from ‘@testing-library/react’;
import MyComponent from ‘./MyComponent’;
test(‘increments counter on button click’, () => {
render(<MyComponent title=”Counter Test” />);
const button = screen.getByText(/increment/i);
fireEvent.click(button);
expect(screen.getByText(/count: 1/i)).toBeInTheDocument();
Debugging Scenarios
Certain debugging scenarios tend to pop up frequently in React. Here’s how to handle a few of them:
- Stuck State or Props
If you find state or props are not updating as expected, check useEffect dependencies and component lifecycle methods to ensure they are being called correctly.
- Memory Leaks
Memory leaks can occur with unmounted components, particularly with event listeners or intervals. Cleaning up functions like event listeners or API calls in your lifecycle methods can help prevent memory leaks. You can use the cleanup function in useEffect to avoid such issues. Here’s an example:

3. Performance Issues
Use React’s Profiler tab or optimization techniques like shouldComponentUpdate or React.memo to control re-rendering and optimize performance. Here’s how:
const MemoizedComponent = React.memo(function MyComponent(props) {
return <div>{props.data}</div>;
Final Word
Effective debugging is a skill that can significantly speed up your development process in React. By using tools like React Developer Tools, setting up breakpoints, leveraging Error Boundaries, and writing tests, you can solve problems more quickly and confidently. Developing good debugging habits will help you write better, more reliable code and ultimately make you a stronger React developer. Keep practicing these techniques, and don’t hesitate to explore new debugging tools as they emerge.


